
Page 6 - Lake Roosevelt Forum 2020 Public Guide
P. 6
Human Health Risk Assessment
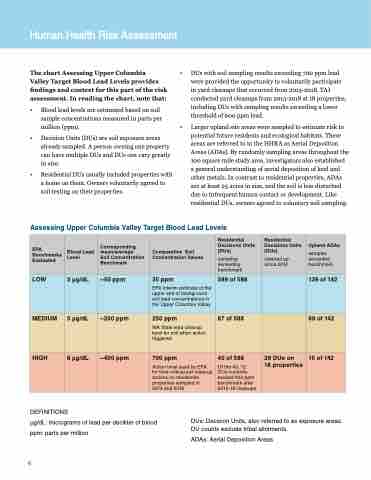
The chart Assessing Upper Columbia
Valley Target Blood Lead Levels provides findings and context for this part of the risk assessment. In reading the chart, note that:
• Blood lead levels are estimated based on soil sample concentrations measured in parts per million (ppm).
• Decision Units (DUs) are soil exposure areas already sampled. A person owning one property can have multiple DUs and DUs can vary greatly in size.
• Residential DUs usually included properties with a home on them. Owners voluntarily agreed to soil testing on their properties.
• DUs with soil sampling results exceeding 700 ppm lead were provided the opportunity to voluntarily participate in yard cleanups that occurred from 2015-2018. TAI conducted yard cleanups from 2015-2018 at 18 properties, including DUs with sampling results exceeding a lower threshold of 600 ppm lead.
• Larger upland site areas were sampled to estimate risk to potential future residents and ecological habitats. These areas are referred to in the HHRA as Aerial Deposition Areas (ADAs). By randomly sampling areas throughout the 100 square mile study area, investigators also established a general understanding of aerial deposition of lead and other metals. In contrast to residential properties, ADAs are at least 25 acres in size, and the soil is less disturbed due to infrequent human contact or development. Like residential DUs, owners agreed to voluntary soil sampling.
Assessing Upper Columbia Valley Target Blood Lead Levels
EPA Benchmarks Evaluated
Blood Lead Level
Corresponding mean/average
Soil Concentration Benchmark
Comparative Soil Concentration Values
Residential Decisions Units (DUs)
sampling exceeding benchmark
Residential Decisions Units (DUs)
cleaned up since 2014
Upland ADAs
samples exceeded benchmark
LOW
3 μg/dL
~50 ppm
35 ppm
EPA interim estimate of the upper end of background soil lead concentrations in the Upper Columbia Valley
389 of 588
139 of 142
MEDIUM
5 μg/dL
~200 ppm
250 ppm
WA State lead cleanup level for soil when action triggered
87 of 588
68 of 142
HIGH
8 μg/dL
~400 ppm
700 ppm
Action level used by EPA for time-critical soil cleanup actions on residential properties sampled in
2014 and 2016
40 of 588
Of the 40, 12 DUs currently exceed 400 ppm benchmark after 2015-18 cleanups
28 DUs on
18 properties
15 of 142
6
DEFINITIONS
μg/dL: micrograms of lead per deciliter of blood ppm: parts per million
DUs: Decision Units, also referred to as exposure areas. DU counts exclude tribal allotments.
ADAs: Aerial Deposition Areas
